Level 2 - Throughput time analysis
Level 2 - Throughput Time Analysis
Overview
The second level of the simulation is useful in measuring end-to-end process time.
Here, resources are not included; Bizagi assumes an infinite capacity to avoid delays in the process flow. This is the best-case scenario under the given flow and processing times.
Defining the input data required for this level
In addition to the information specified in the previous level, the following must be defined in the Throughput Time Analysis:
Arrival interval time:
Defines the time interval between token instances generation. Instances will be created until the Max.arrival count is reached. This applies to Start Events, Activities that start processes, or Timer Events.
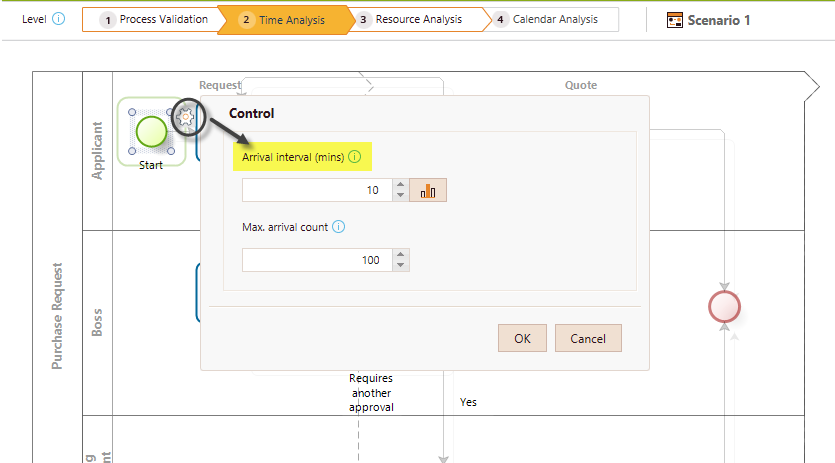
Select the Start Event of the process and click the Gear icon on the pie menu. Set the value for the control.
-
One option is to define the arrival interval time as a constant by entering a value. The time units for this value are defined in the scenario´s configuration.
In the following image, token instances are generated every 5 minutes.
-
Alternatively, define a statistical distribution. Click the advanced icon alongside the field to view and select a distribution.
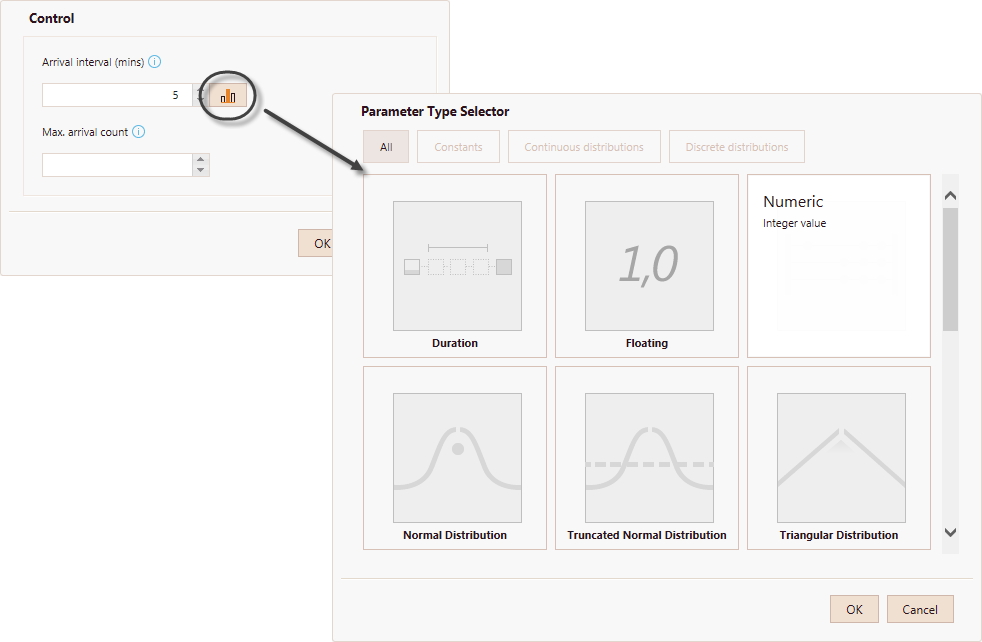
Once selected, you will be able to set the parameters of the distribution.
In the following image, the time between generation of token instances is exponentially distributed with a mean of 5 minutes. Tokens will be generated until 100 are reached.

Processing times:
Defines the amount of time an Activity or Event needs to process a token. That is, it defines a service time period from the moment a token arrives at an Activity or Event until it is executed.
When the process contains embedded Sub-Processes, regard the following:
- If the Sub-Process has activities, assign time to each activity and not to the Sub-Process in order to calculate the process time from the execution of each activity.
- If the Sub-Process does not have activities, assign an estimated process time to it.
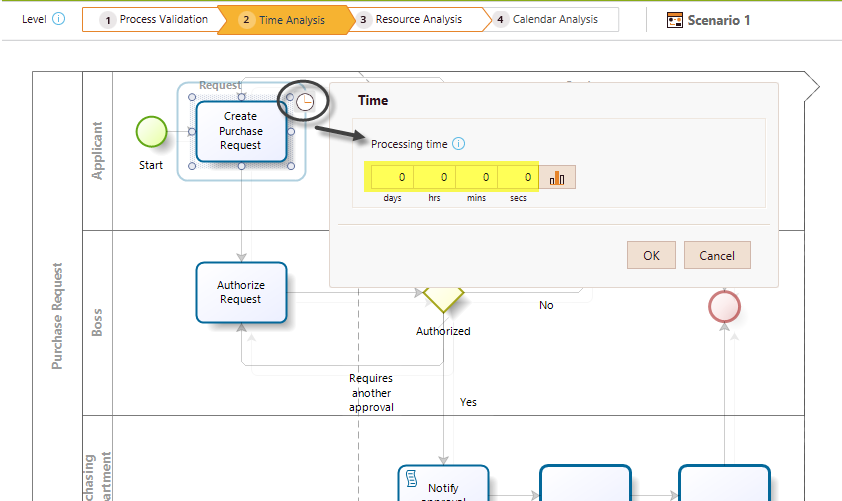
Click the Activity or Event. Select the Clock on the pie menu, and enter a processing period in the Time Control.
-
You have the option of defining the processing time as a constant by entering values in the corresponding units.

-
Alternatively, define a statistical distribution. Click the advanced icon alongside the field to view and select a distribution.
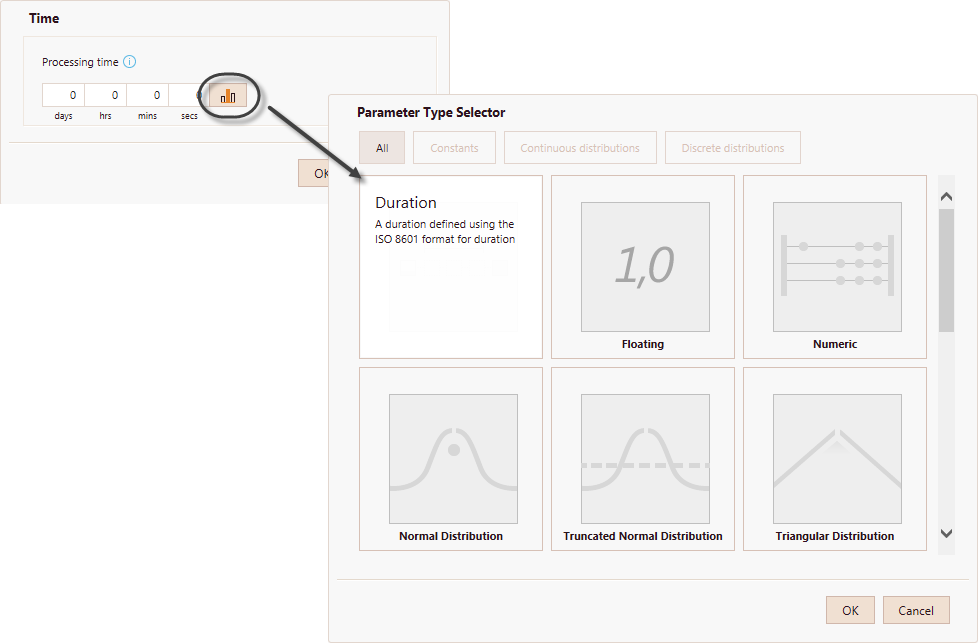
Once selected, you will be able to set the parameters of the distribution.
In the following image, the processing time of a token in a specific activity is normally distributed with a mean of 5 minutes and a standard deviation of 3 minutes.

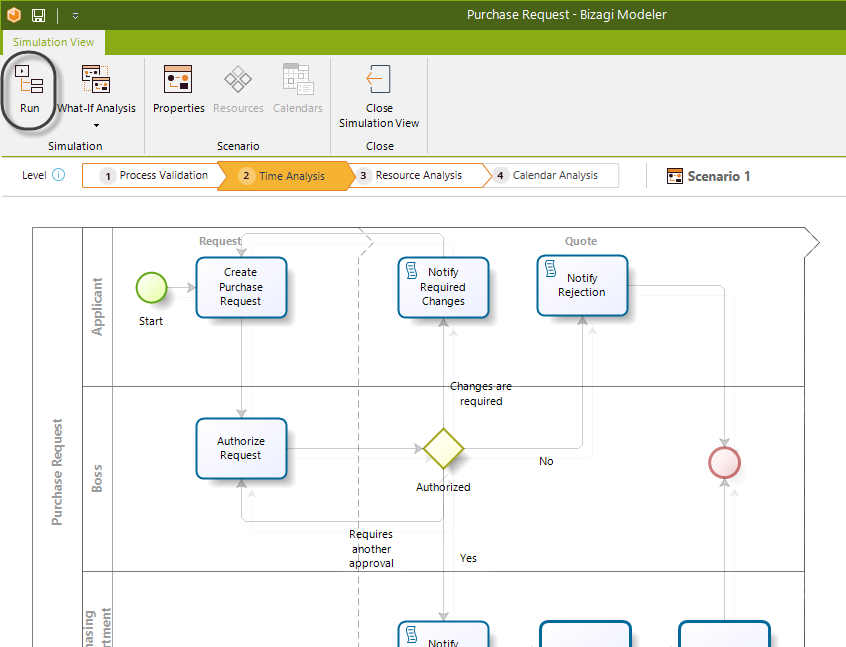
Running the simulation
Once the required data for this level have been defined, click the Run button to execute the simulation.
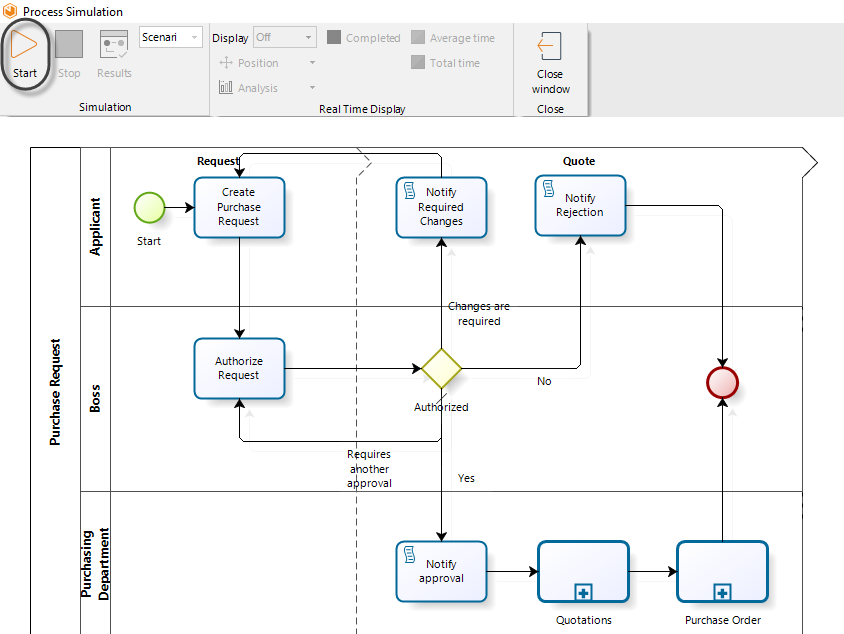
In the new window, click Start to run the simulation.
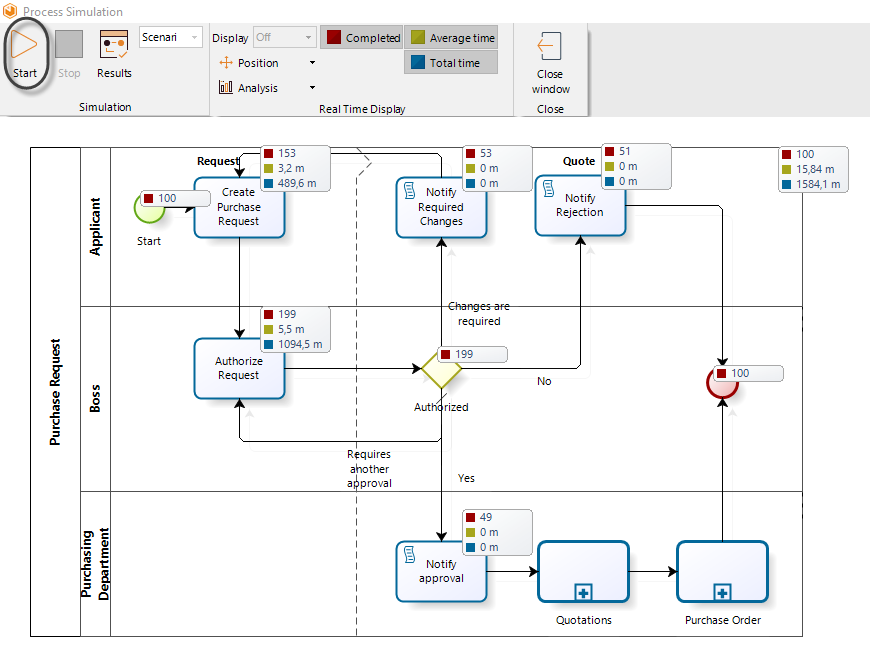
When running a simulation, the following analysis data will display:
-
Number of tokens completed.
-
Average time per activity.
-
Total processing time per activity.
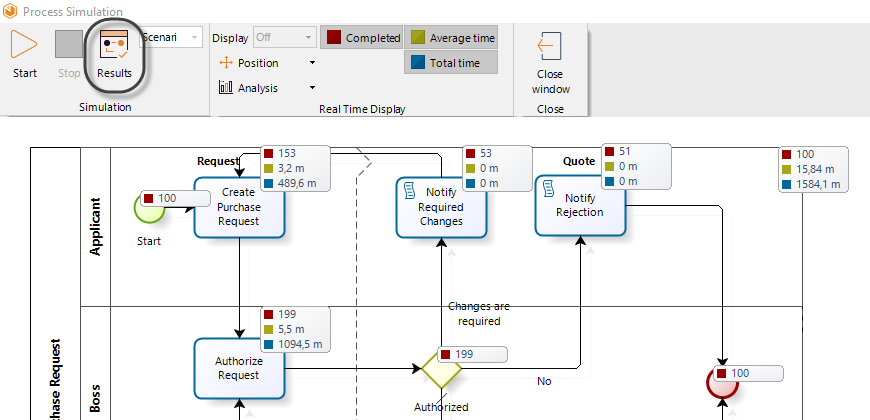
Results
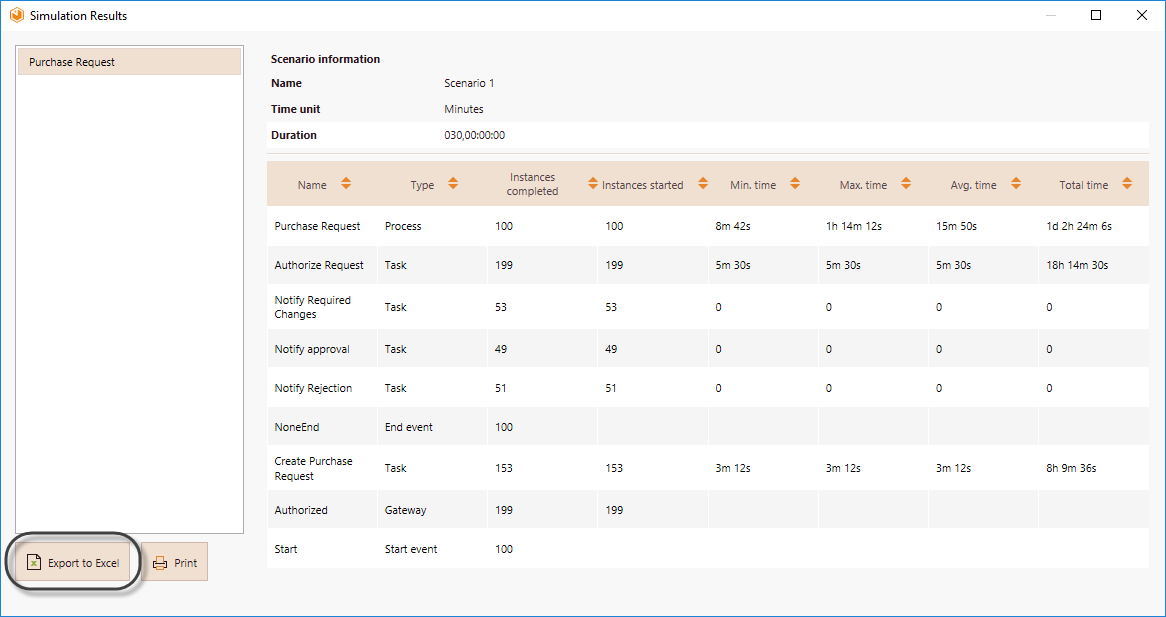
When the simulation is complete, select Results to view the outcome.
For the Time Analysis level, the results of the simulated outcome will contain the following information:
- Name: Identifies the specific shape for which the results are displayed.
- Type: Identifies the element type of the shape.
- Tokens completed: Indicates how many tokens were processed (instances).
- Tokens started: Indicates how many tokens arrived at the shape.
- Minimum time: Indicates the minimum processing time of the shape.
- Maximum time: Indicates the maximum processing time of the shape.
- Average time: Indicates the average processing time of the shape.
- Total time: Indicates the total time employed to process the shape.
You can transfer the results report to Excel by clicking the Export to Excel button.
Example: Performing a time analysis for the Emergency attendance process
In order to provide a general insight into processing times, the emergency response department has decided to perform a time analysis.
For this analysis, the following assumptions have been made:
- Necessary resources to perform activities have infinite capacity.
- The expected time between reports is 5 minutes.
- The simulation will evaluate a period of 1 week.
- The estimated processing times for each of the activities are fixed as shown in the next table:
| Activity | Processing time (min) |
|---|---|
| Receive emergency report | 4 |
| Classify Triage | 5 |
| Manage patient entry | 11 |
| Pick up patient | 20 |
| Arrive at patient place QAV | 7 |
| Arrive at patient place BA | 10 |
| Authorize entry | 4 |
-
Define trigger times:
To do so, click the Start Event and then the Gear icon on the pie menu.
For this example, the expected time between reports is 5 minutes, so set the time to this value. Note the value entered is in minutes.
For more information about units, please refer to Scenarios.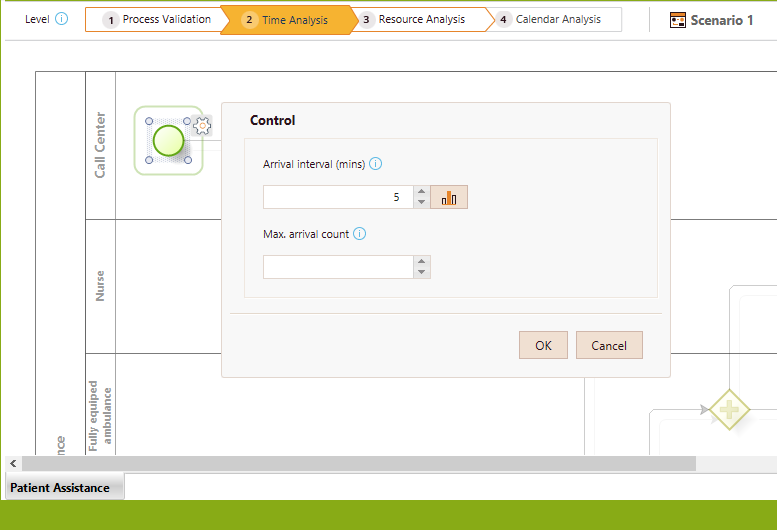
-
Define the Activities' processing times:
Click the Activity, select Clock on the pie menu, and set a value for the Time control.
In the following image, the processing time for the first activity is set to 4 minutes.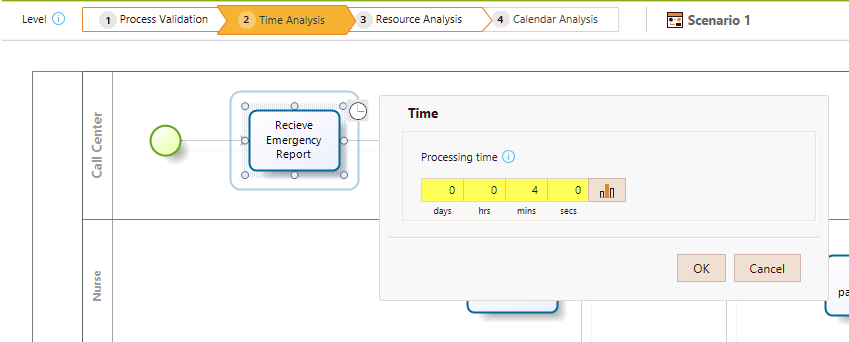
-
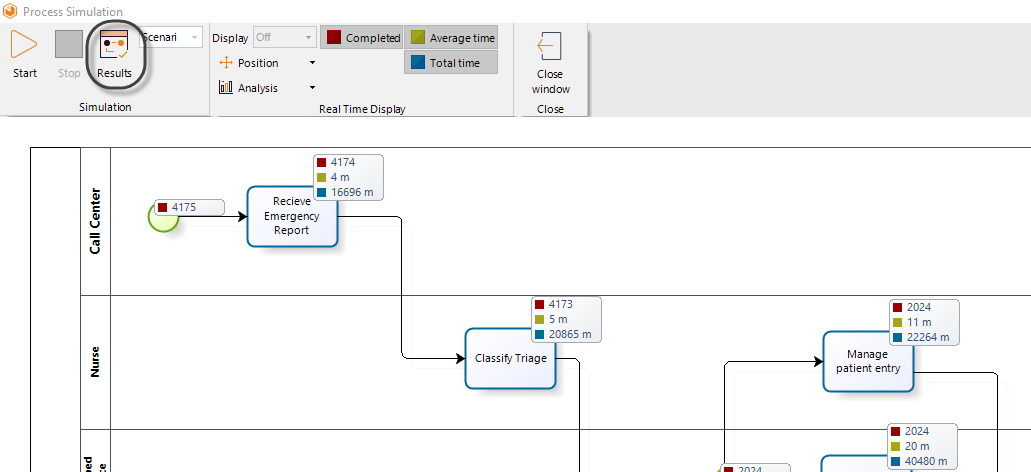
Once all the processing times have been defined, run the simulation. Click the Run button.
Note the simulation shows analysis findings for each shape in real time as it executes, such as average time, total processing time, and the number of completed tokens.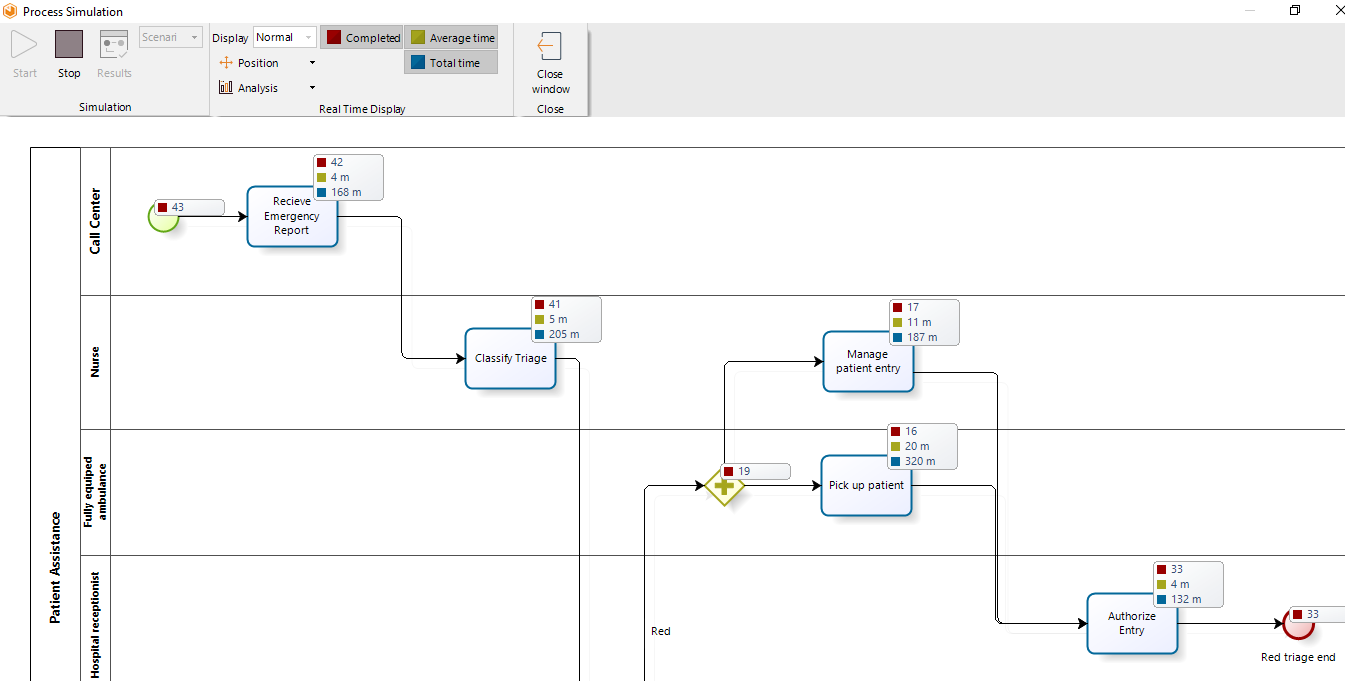
-
When the simulation is finished, select Results to view the outcome.
Analyzing the results
As we mentioned before, the results on this level give us a general insight into the cycle time of the process. For this specific case, we are able to identify the expected time a person has to wait from the moment the emergency is reported until medical attention is received.
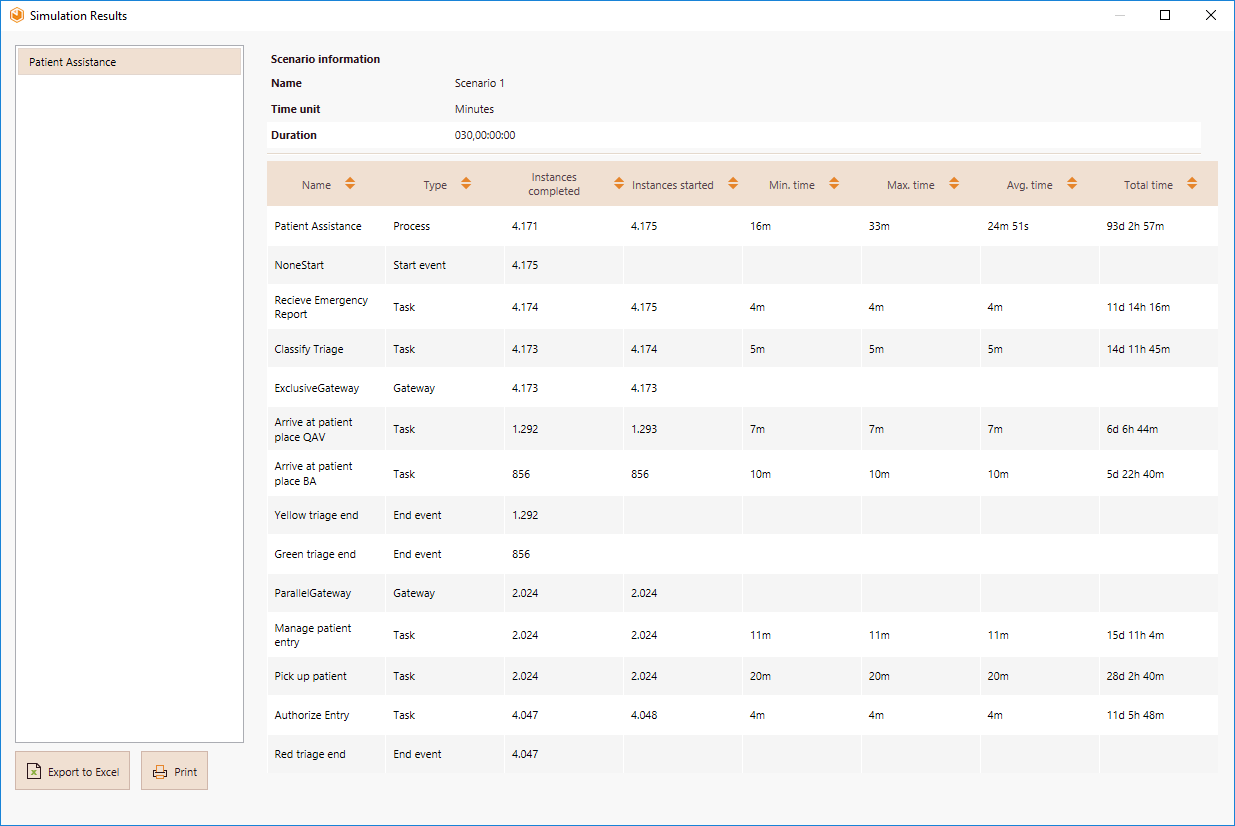
Based on the results, we can conclude:
- A patient waits at least 16 minutes before receiving medical attention.
- A patient waits no more than 33 minutes for medical attention.
- The expected time a patient waits to receive medical attention is 24 minutes 51 seconds.